
Products Nuvola CyL

Nuvola CyL
The weather for all 2,248 municipalities of Castilla y León in one website, with official data and updated automatically.
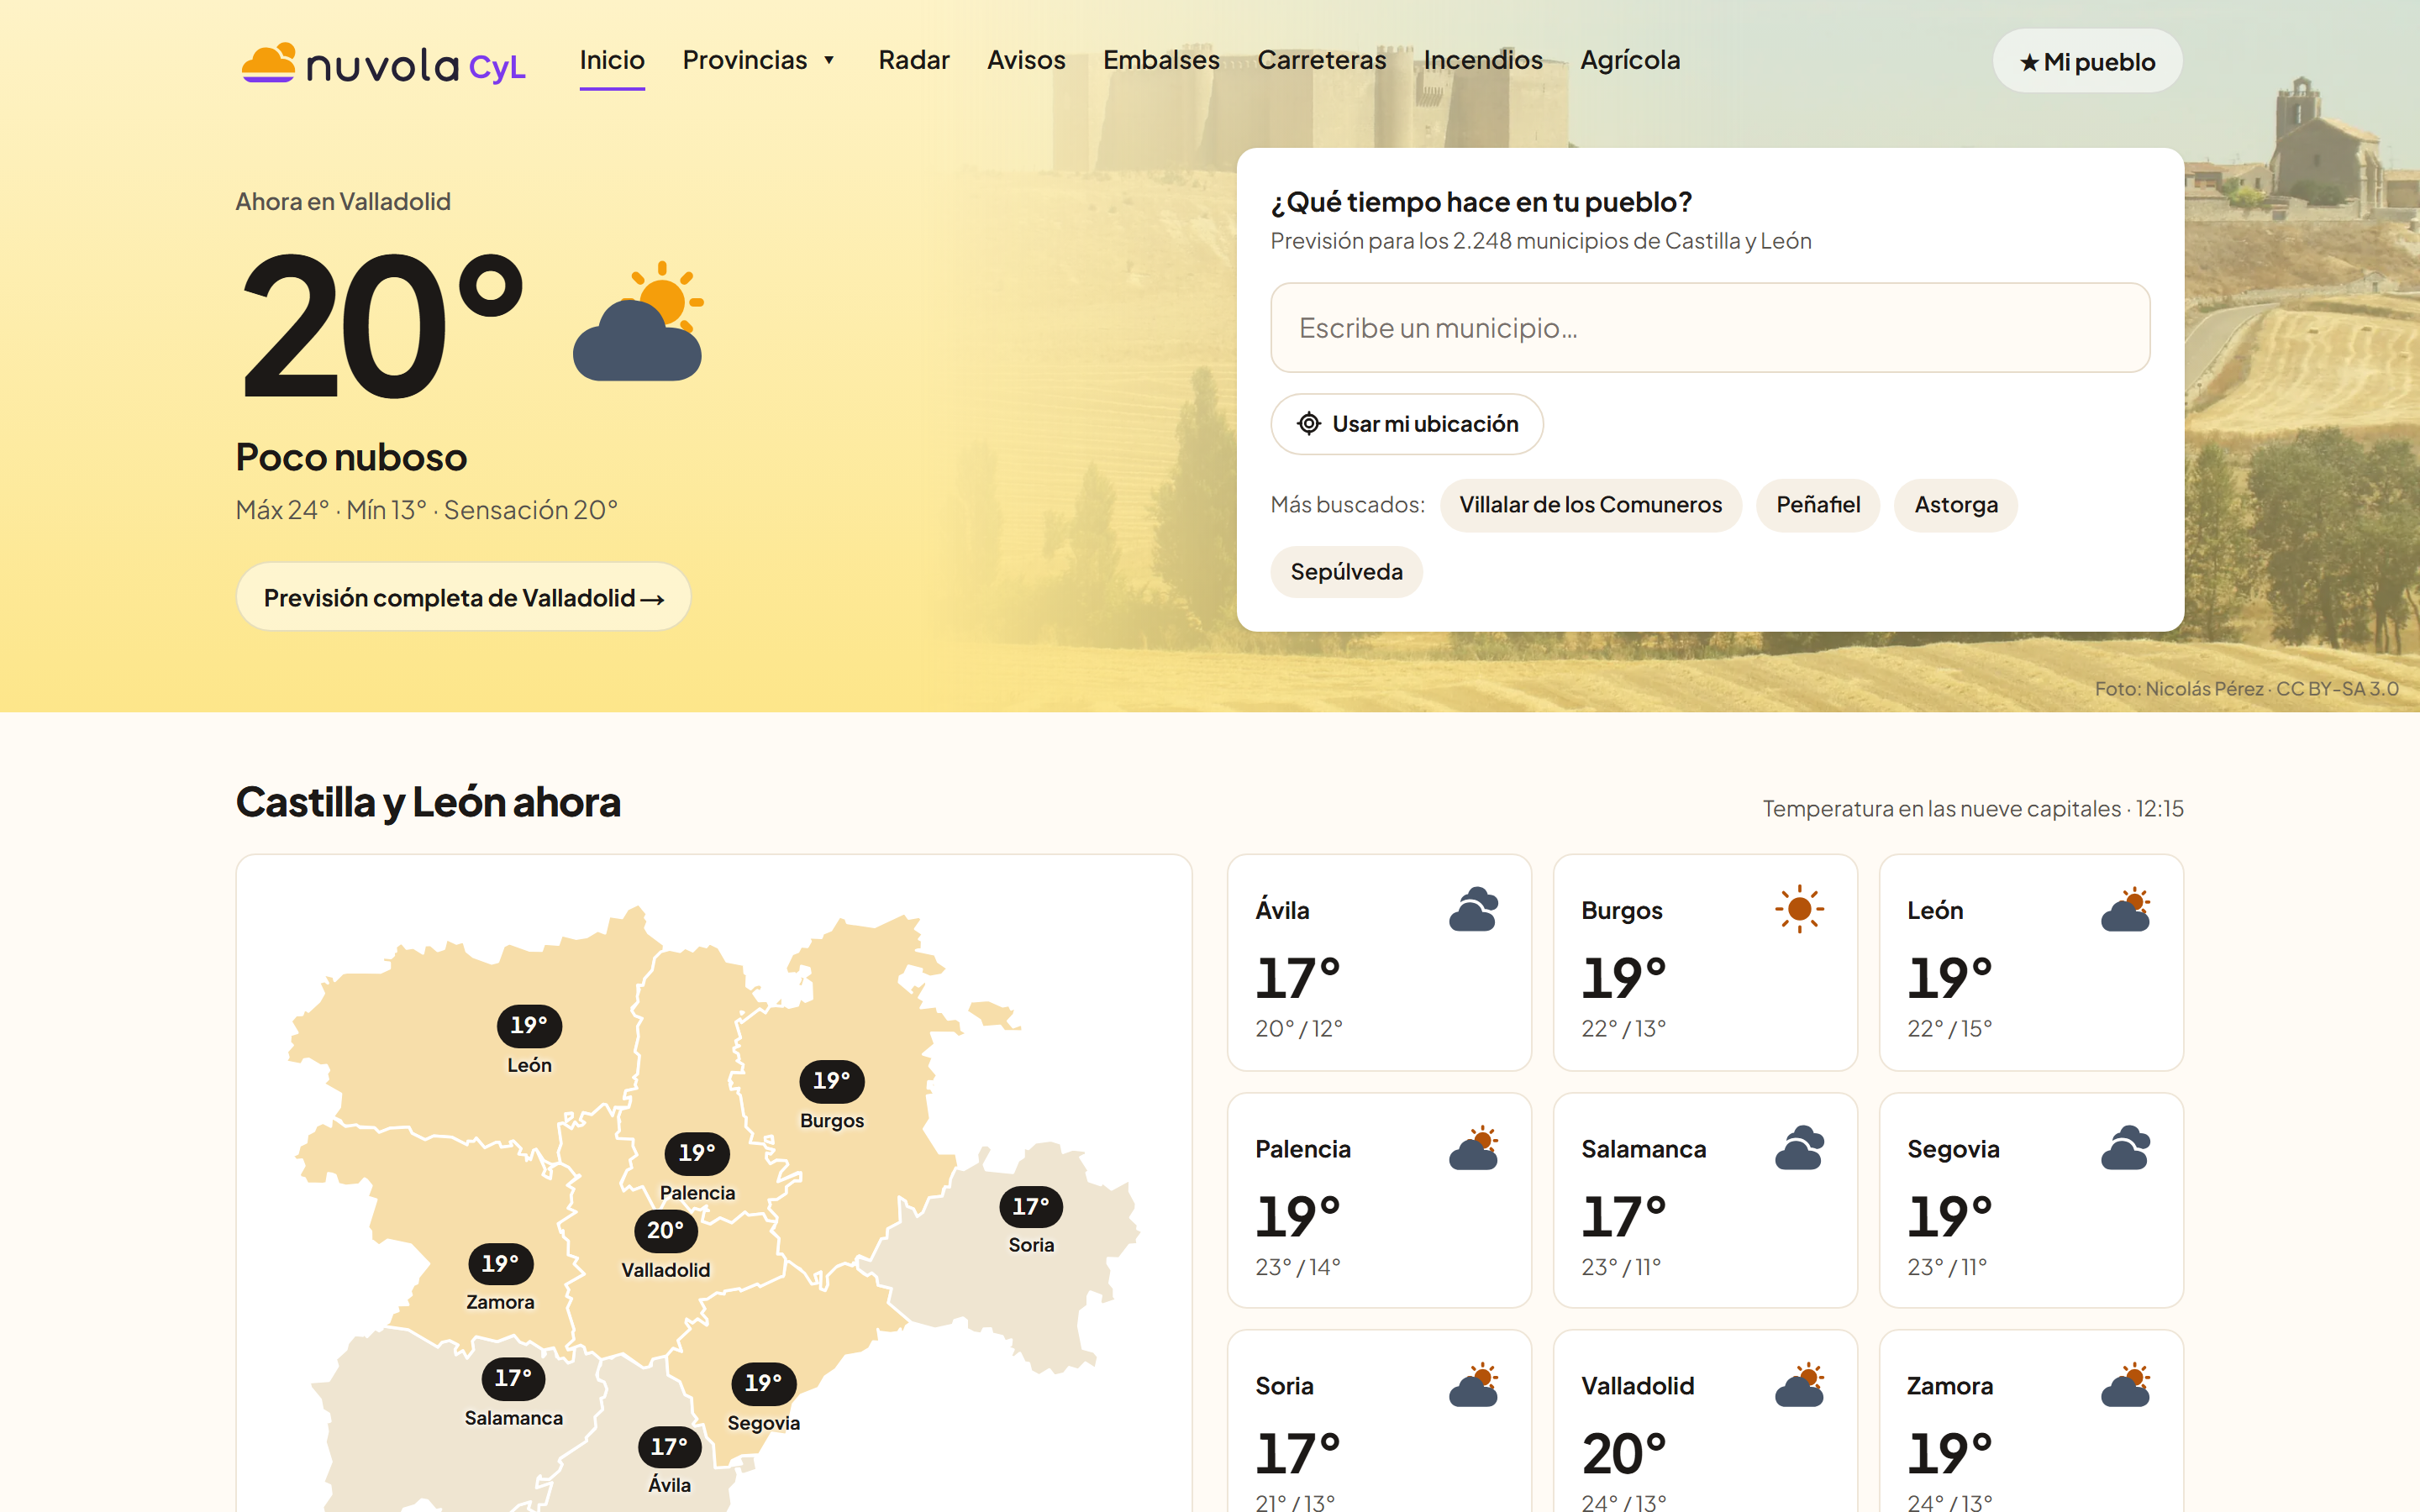
The problem
In Castilla y León, the weather that matters isn't just whether it rains: it's also the warnings, the state of the reservoirs, roads with snow, soil moisture for farming and wildfire danger. Each is published by a different body, in a different format and on its own schedule.
Nuvola CyL brings it together by municipality, each figure with its source, and keeps itself up to date.
At a glance
In figures
- 2,248 municipalities in Castilla y León, each with its own page.
- 35 reservoirs in the Duero basin, from MITECO's weekly hydrological bulletin.
- 53 mountain passes with roads, with DGT incidents for snow, ice, snow chains or closures.
Where the data comes from
- AEMET
- Spain's State Meteorological Agency: the official forecast for each municipality, Meteoalerta warnings, regional radar and wildfire danger.
- Open-Meteo and Copernicus
- Weather model forecasts, expected rainfall, air quality and pollen, and soil moisture compared with other years (Copernicus ERA5 and ERA5-Land reanalysis).
- MITECO
- The Ministry for the Ecological Transition's weekly hydrological bulletin: storage in the 35 Duero reservoirs, with records back to 1988.
- DGT
- Road incidents due to snow, ice and bad weather, from the Directorate-General for Traffic's National Access Point.
- INE, Wikidata, IDECyL and Wikimedia Commons
- The municipalities and their population, coordinates and mountain passes, the regional government's farming districts, and the photos, all under free licences with their authors credited.
How we built it
Two forecasts, side by side
The model forecast always appears next to AEMET's official forecast for the same municipality. When they disagree, you can see it.
Warnings for the official zone, not the neighbour's
Each municipality shows the warnings for its AEMET zone according to the official Meteoalerta table, not by proximity on a map.
Not mixing what can't be compared
The forecast and the reanalysis measure soil at different depths, so comparisons with other years are always made within the reanalysis. And if a figure isn't available, it says so instead of making it up.
Data, not advice
It doesn't say when to irrigate or treat a crop: these are model data for an area, not measurements of a plot. It shows them so the people who know their fields can decide.
It runs itself, and raises an alert if something fails
Each source updates on its own schedule, from every few minutes (warnings, radar, roads) to once a week (reservoirs), without anyone touching anything. A daily check makes sure the live website works and raises an alert if it doesn't.
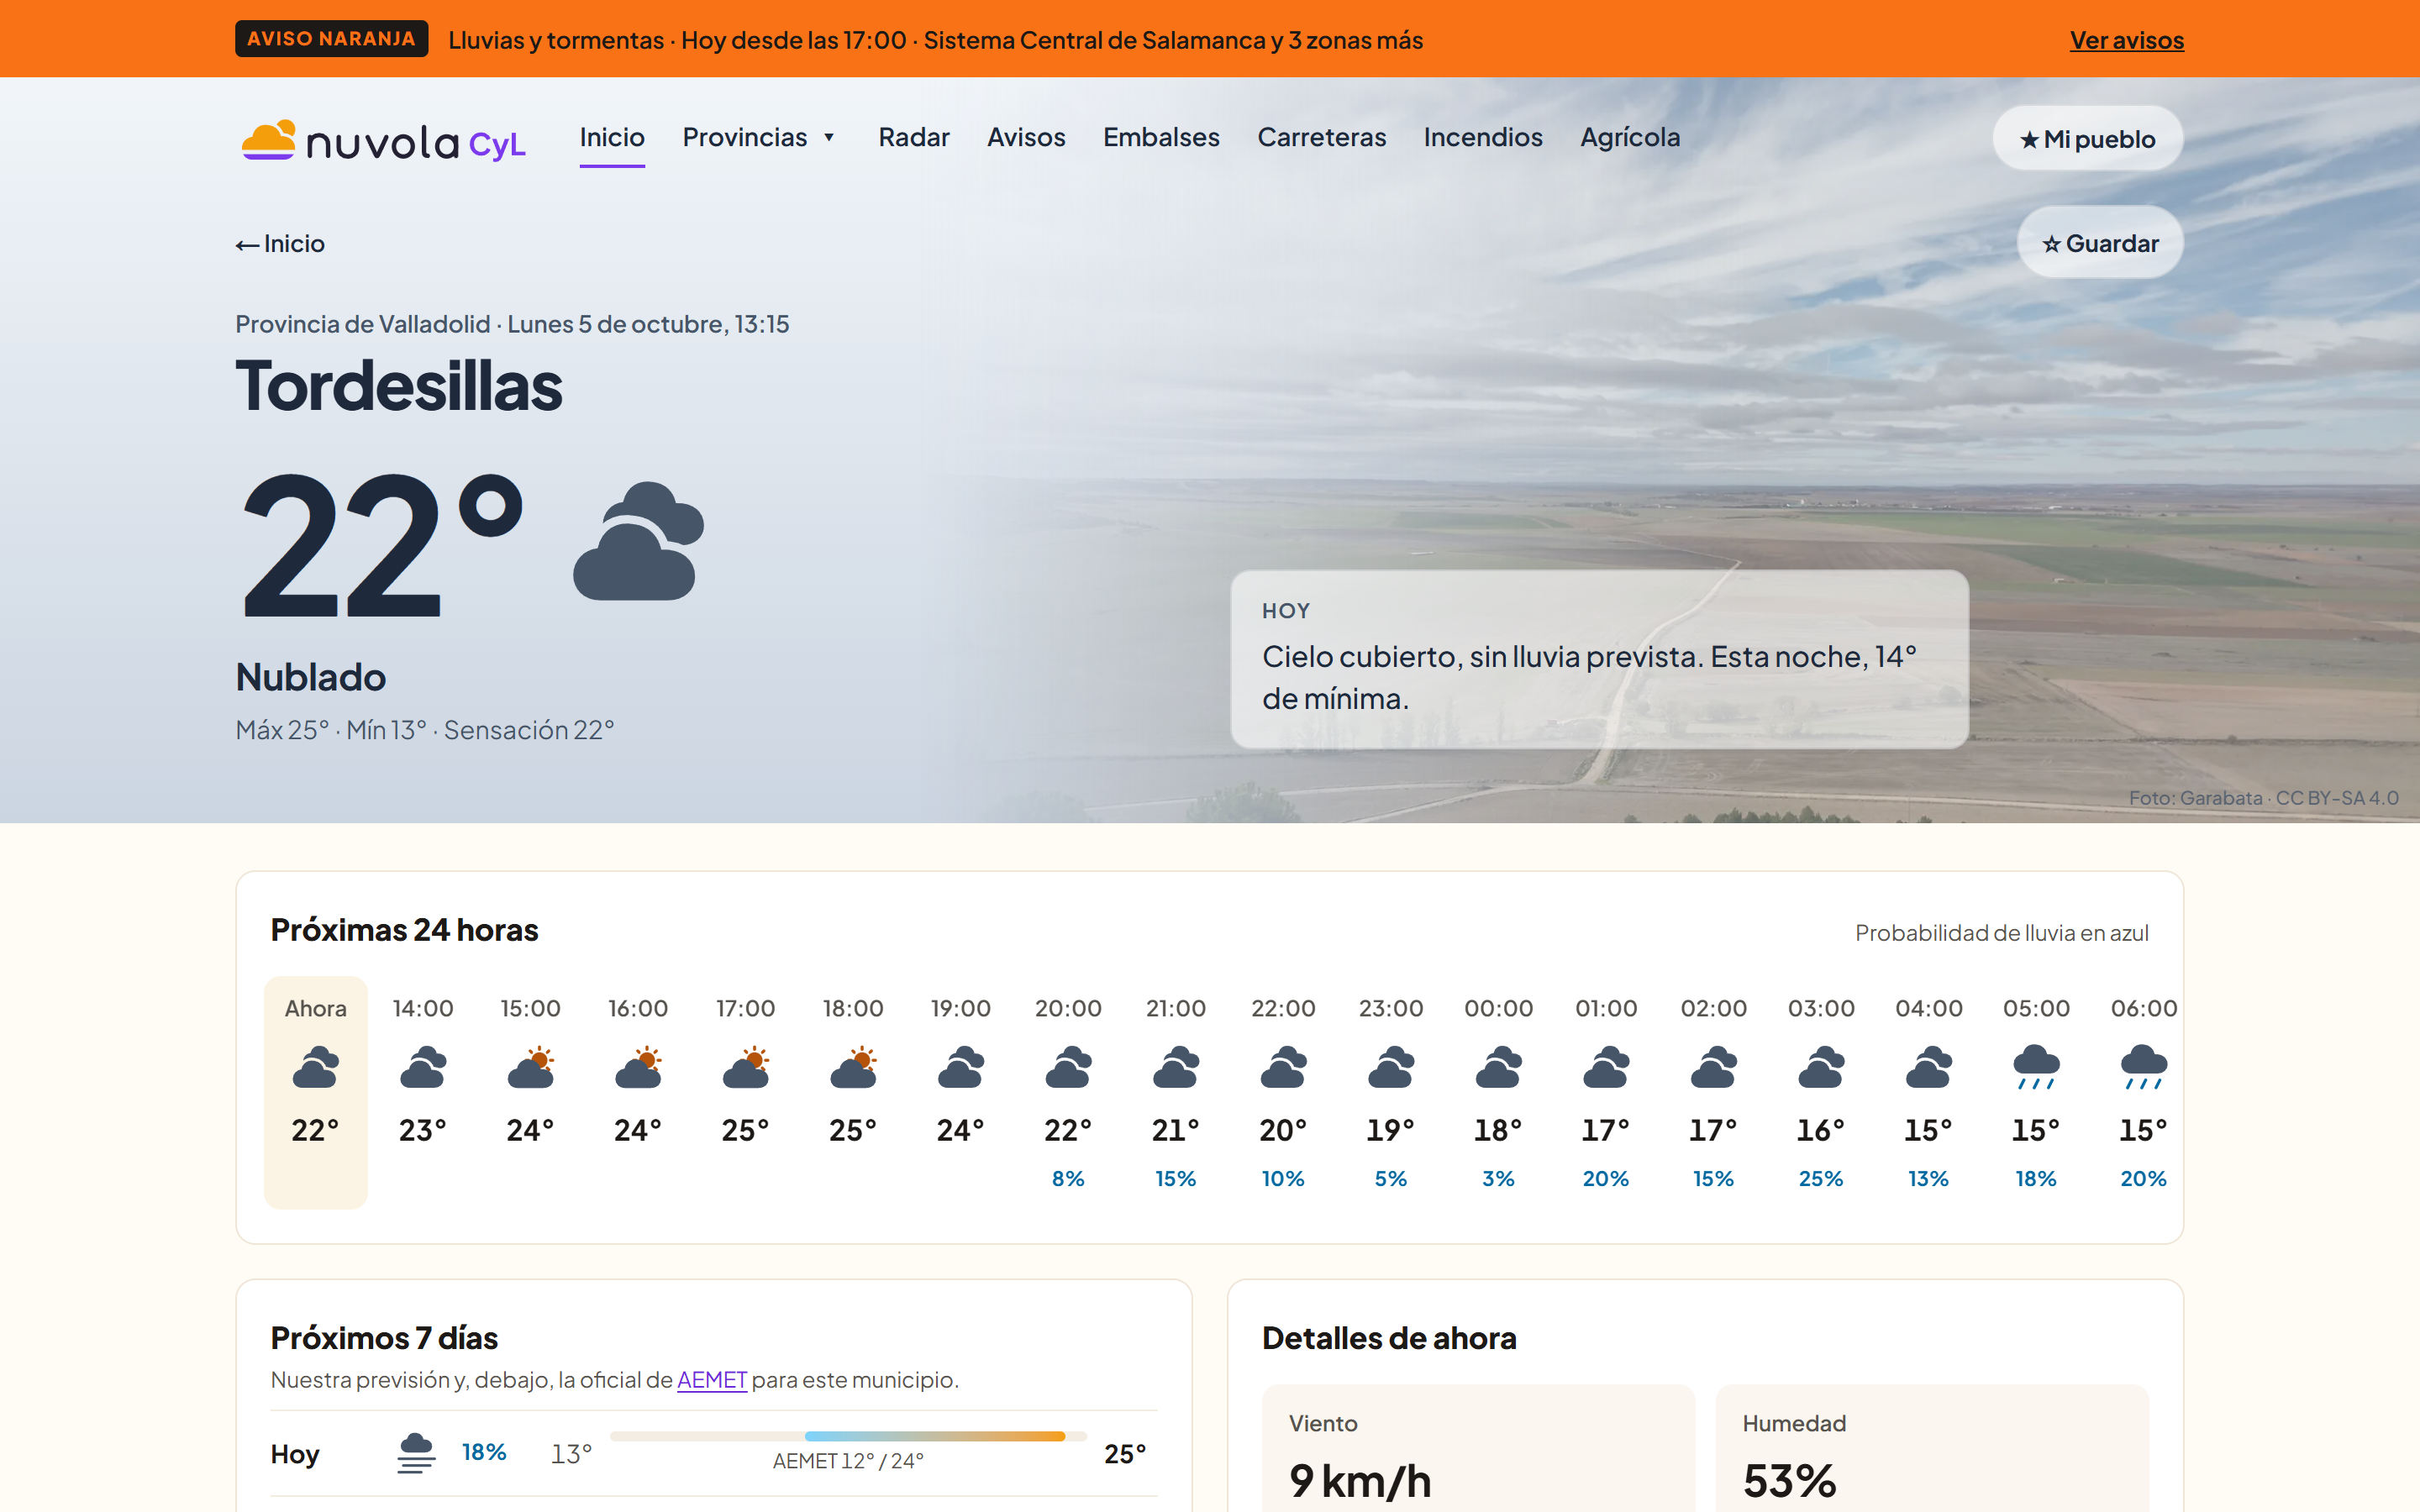
Each municipality's page
Credits
Información elaborada utilizando, entre otras, la obtenida de la Agencia Estatal de Meteorología.
Weather data by Open-Meteo.com (CC BY 4.0), with Copernicus data.
Reservoirs: Ministry for the Ecological Transition and the Demographic Challenge. Traffic: Directorate-General for Traffic.